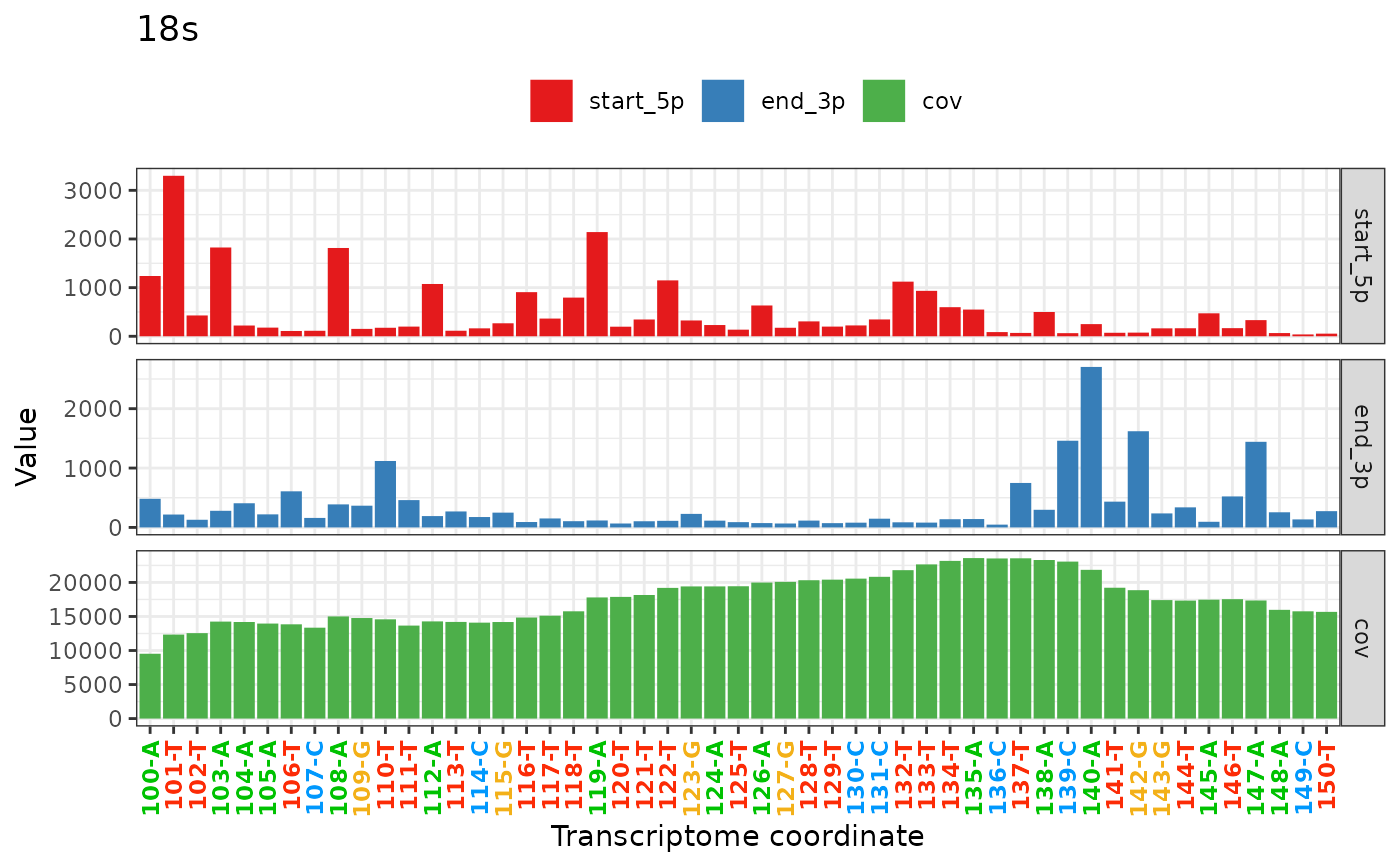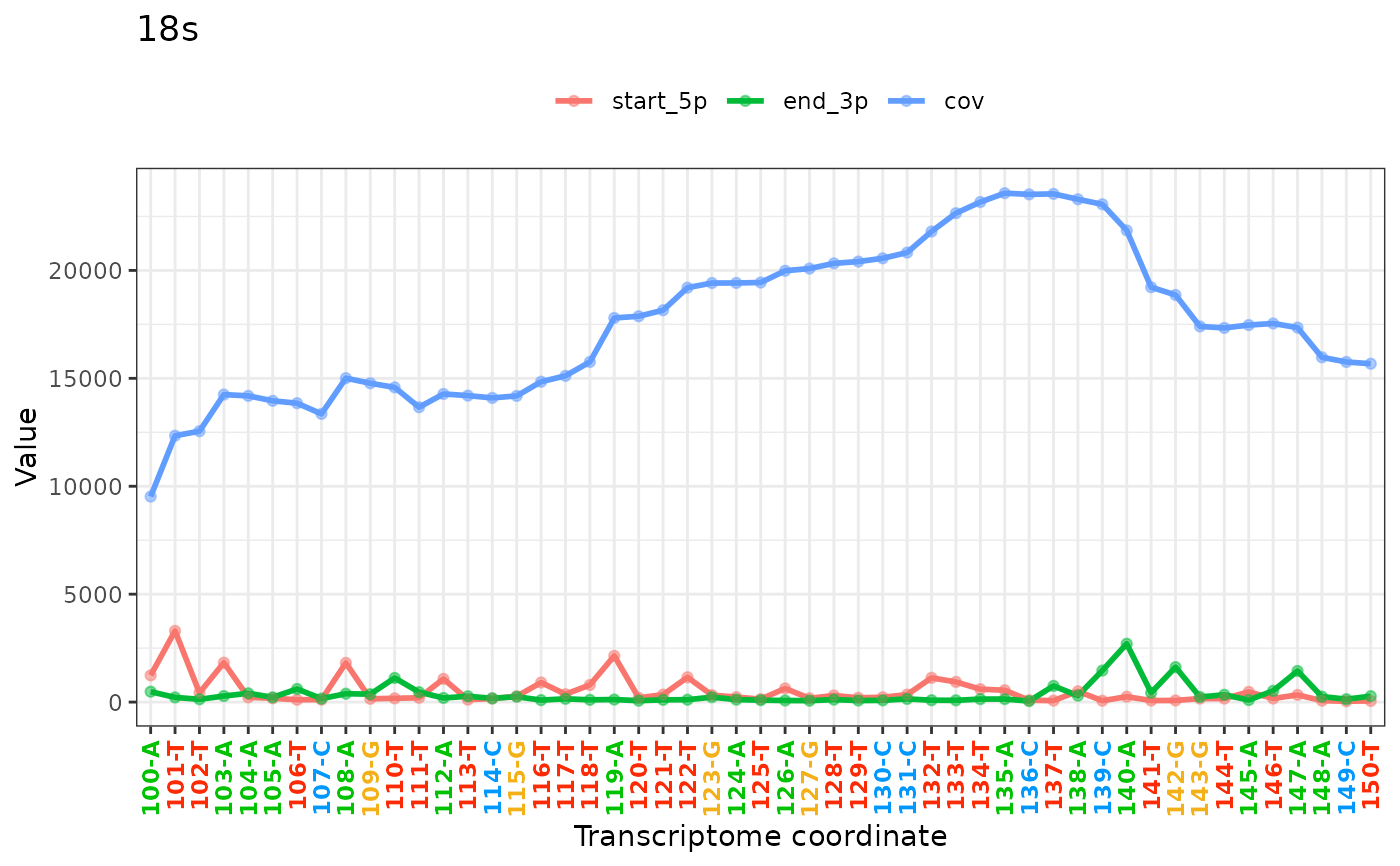
Numeric plot
tx_plot_numeric.RdPlot numeric variables in a txDT by gene and in a specified range
Usage
tx_plot_numeric(
  DT,
  gene,
  colVars,
  txRange = 1:nrow(DT),
  plot_type = "lineplot",
  lwd = 1,
  addPoints = TRUE,
  scales = "fixed",
  show_yLabels = TRUE,
  showLegend = TRUE
)
Arguments
- DT
data.table. Input data from which to generate the plot
- gene
character
- colVars
character. Names of columns for which values will be extracted
- txRange
integer. Range in data to be used, 'txcoor' column is used to delimit this range in the data.table.
- plot_type
character. Type of plot to be output, either "lineplot" or "barplot".
- lwd
numeric. Width of line (lineplot)
- addPoints
logical. Add points to line (lineplot)
- scales
character. Scales the y axis accordingly. Either 'fixed', by default, or 'free_y' (barplot)
- show_yLabels
logical. If set to FALSE hides the y axis labels.
- showLegend
logical. If set to FALSE does not renger a legend.
Details
If the range exceeds 250 bp the labels in the x-axis are not shown by default unless force_xAxis is set to TRUE.
Examples
# Barplot using data from the Use-case-#3
tx_plot_numeric(DT = sc_txDTL[[1]], gene = "18s", txRange = 100:150,
colVars = c("start_5p", "end_3p", "cov"), plot_type = "barplot", scales = "free")


# Lineplot using data from the Use-case-#3
tx_plot_numeric(DT = sc_txDTL[[1]], gene = "18s", txRange = 100:150,
colVars = c("start_5p", "end_3p", "cov"), plot_type = "lineplot")
